Dashboard Overview
The Dashboard is your control center in LKG Billing. It provides a quick overview of your business performance and easy access to all features.
📊 Dashboard Layout
When you first log in, you'll see the Dashboard with several key sections:
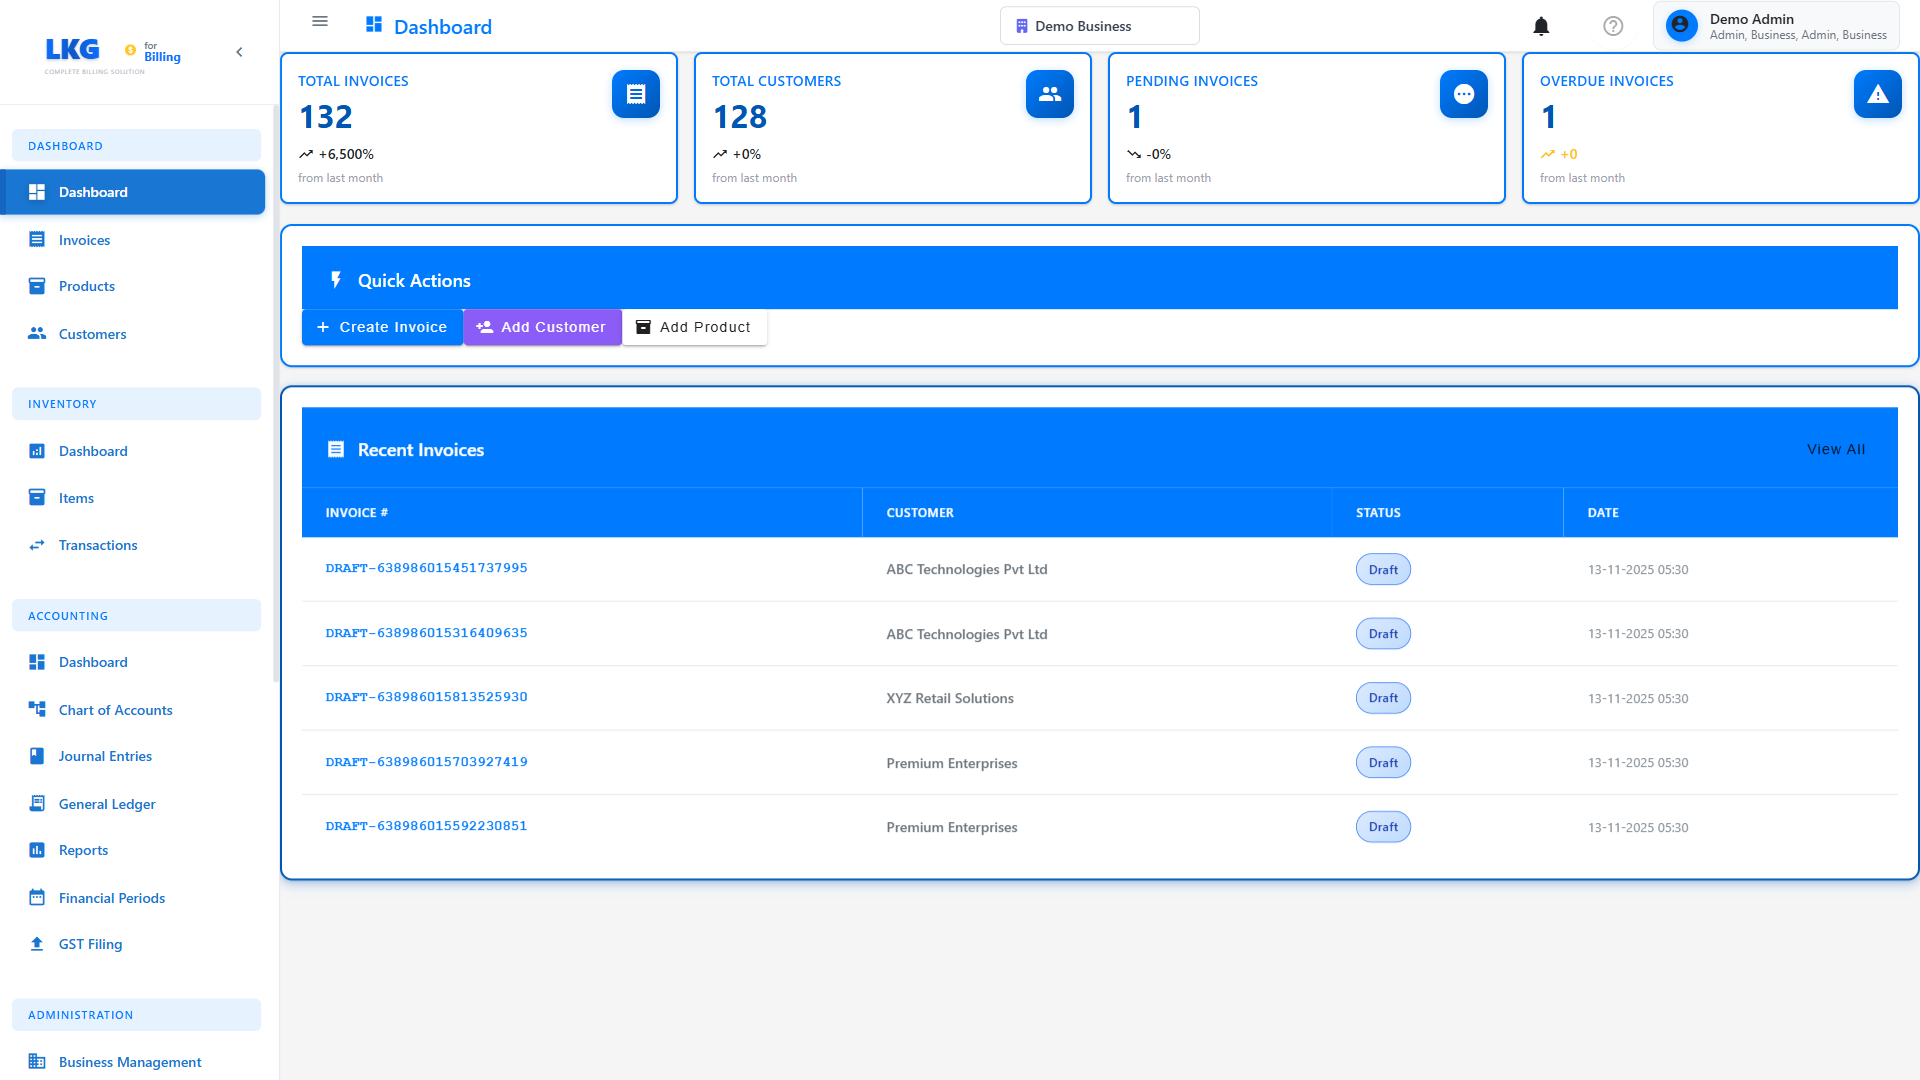
Key Dashboard Components
- Navigation Menu - Access all application features
- Summary Cards - Quick stats (Total Customers, Products, Invoices, Revenue)
- Recent Activity - Latest invoices, payments, and transactions
- Quick Actions - Fast access to common tasks
- Charts & Graphs - Visual representation of your business data
🧭 Navigation Menu
The main navigation menu (usually on the left or top) provides access to:
- Dashboard 🏠 - Return to the main overview
- Customers 👥 - Manage customer information
- Products 📦 - Manage products and services
- Invoices 📋 - Create and manage invoices
- Payments 💰 - Track and record payments
- Reports 📊 - Generate business insights
- Settings ⚙️ - Configure application preferences
📈 Summary Cards
The dashboard displays important metrics at a glance:
Total Customers
Shows the total number of customers in your database.
Sample Value: 127 Customers
Total Products
Displays the number of products/services you offer.
Sample Value: 45 Products
Total Invoices
Count of all invoices (draft, sent, paid, overdue).
Sample Value: 342 Invoices
Total Revenue
Your total income from paid invoices.
Sample Value: ₹12,45,670.00
Click on any summary card to view detailed information for that category.
🎯 Quick Actions
Quick action buttons let you perform common tasks instantly:
- ➕ New Invoice - Create an invoice immediately
- 👤 Add Customer - Quickly add a new customer
- 📦 New Product - Add a product to your catalog
- 💵 Record Payment - Log a payment received
📊 Charts & Visualizations
The dashboard typically includes:
Revenue Chart
Visual representation of your revenue over time (daily, weekly, monthly).
Invoice Status Distribution
Pie chart showing:
- Paid invoices (green)
- Pending invoices (yellow)
- Overdue invoices (red)
- Draft invoices (gray)
Top Customers
List of customers with highest transaction volumes.
Recent Invoices
Table showing your latest invoices with:
- Invoice number
- Customer name
- Amount
- Status
- Due date
🔔 Notifications & Alerts
Look for notification icons that show:
- Overdue invoices
- Pending payments
- System messages
- Important updates
💡 Dashboard Tips
- Bookmark the Dashboard - Set it as your browser homepage for quick access
- Check Daily - Review overdue invoices and pending payments regularly
- Use Quick Actions - Save time by using the quick action buttons
- Monitor Trends - Watch the revenue chart to understand business patterns
- Set Goals - Use the metrics to track your business growth
🎨 Customizing Your Dashboard
Depending on your settings, you may be able to:
- Rearrange widgets
- Show/hide specific sections
- Choose date ranges for charts
- Set default currency and language
Visit Settings to customize your dashboard experience.
🚀 Next Steps
From the dashboard, you can navigate to:
- Customers - Start managing your customer base
- Products - Build your product catalog
- Invoices - Create your first invoice
Ready to manage customers? Click Next to learn about customer management! 👉