Reports & Analytics Overview
Learn how to generate business insights using LKG Billing reports.
📊 What are Reports?
Reports help you understand your business performance through data analysis and visualization. The Reports section provides:
- Financial summaries
- Customer insights
- Product performance
- Payment tracking
- Tax calculations
- Business trends
📈 Reports Dashboard
When you navigate to Reports, you'll see the main analytics dashboard.
Dashboard Features
- Quick Stats - Key metrics at a glance
- Charts & Graphs - Visual data representation
- Report Templates - Pre-built report options
- Custom Reports - Create your own reports
- Export Options - Download in PDF, Excel, CSV
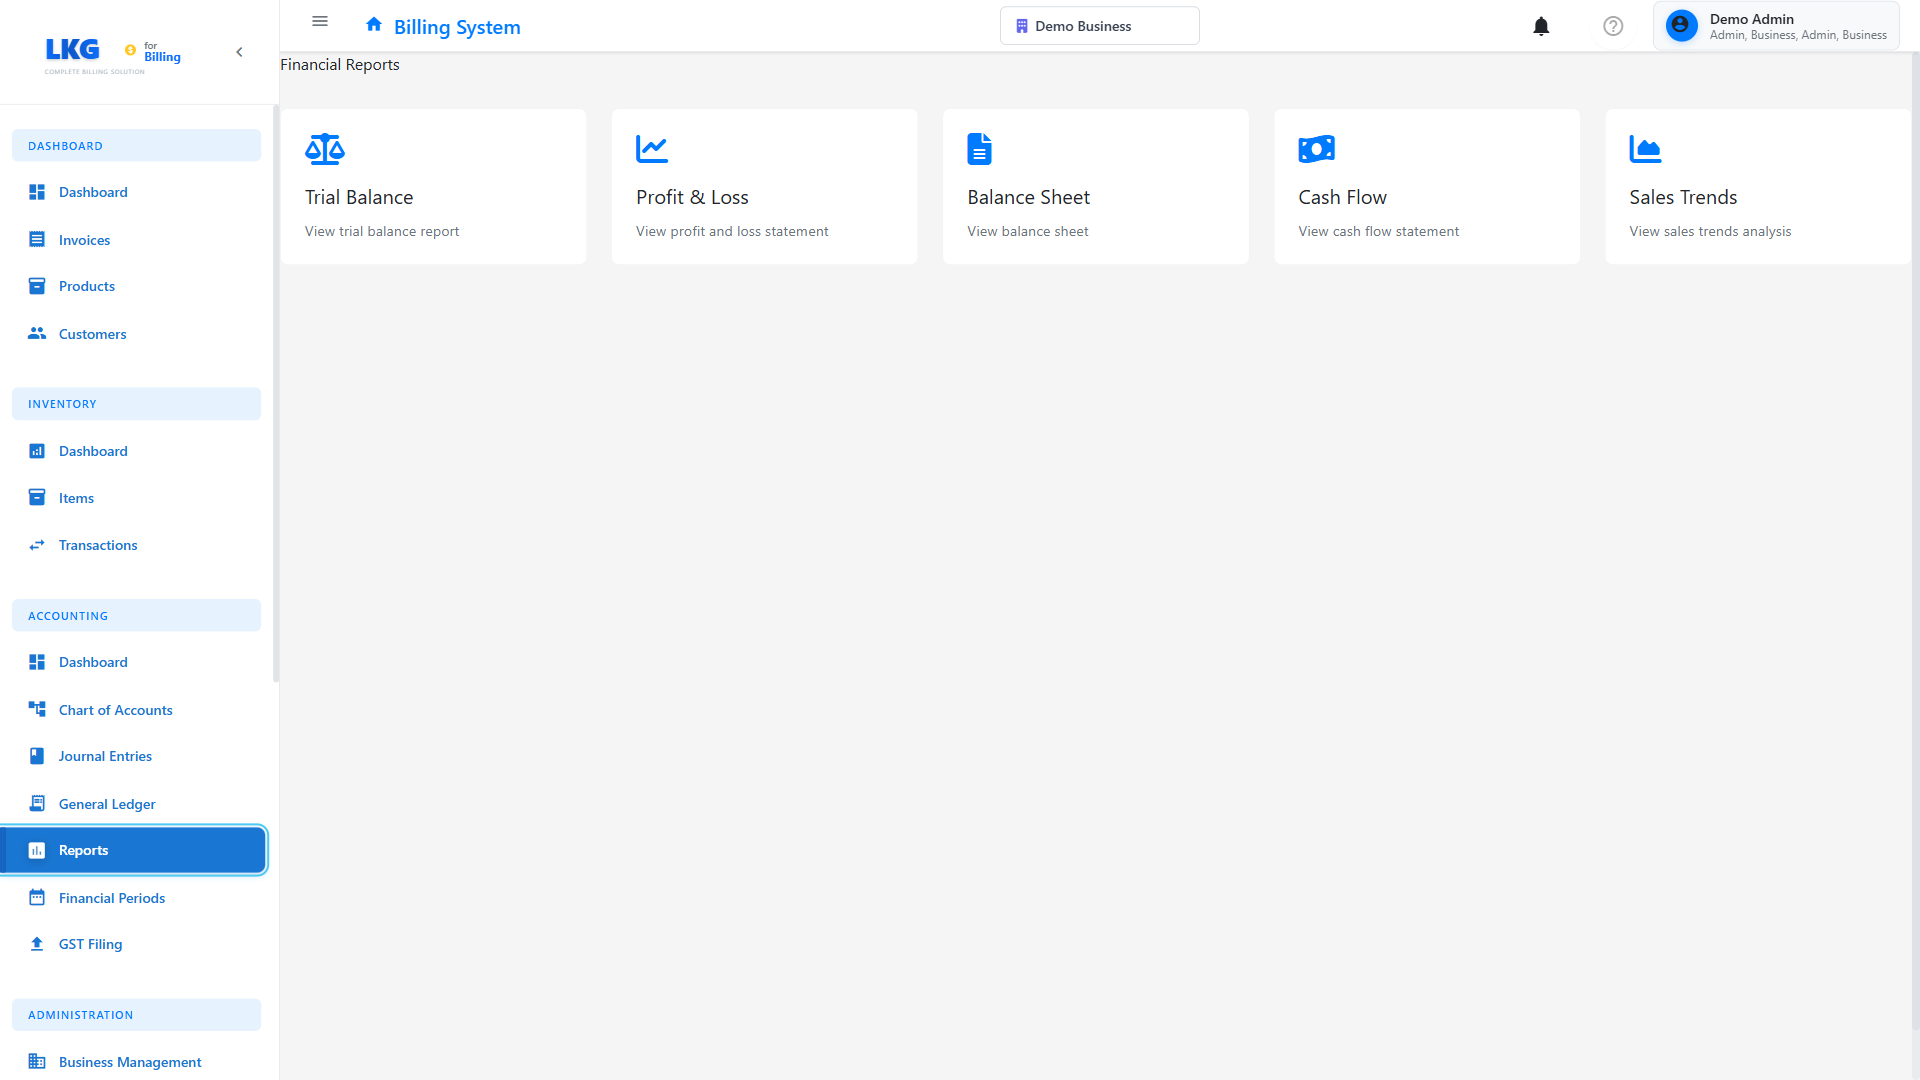
📋 Available Reports
Financial Reports
Sales Report
Track revenue and sales performance.
Includes:
- Total sales by period
- Sales by customer
- Sales by product
- Revenue trends
- Comparison with previous periods
Sample Output:
Sales Report - November 2024

Total Sales: ₹5,47,200
Total Invoices: 45
Average Invoice: ₹12,160
Growth vs Last Month: +15%

Top Customers:
1. Acme Corp - ₹85,000
2. Tech Solutions - ₹67,500
3. Mumbai Retail - ₹54,200
Revenue Report
Analyze income patterns.
Includes:
- Monthly revenue
- Revenue by category
- Recurring vs one-time
- Revenue forecasts
Profit & Loss (P&L)
Complete financial statement.
Includes:
- Total income
- Expenses (if tracked)
- Gross profit
- Net profit
- Profit margins
Invoice Reports
Invoice Summary
Overview of all invoices.
Filters:
- Date range
- Status (Paid, Pending, Overdue)
- Customer
- Amount range
Sample:
Invoice Summary - Q4 2024

Total Invoices: 127
Paid: 89 (₹4,23,500)
Pending: 28 (₹1,56,800)
Overdue: 10 (₹67,900)
Draft: 5 (₹45,200)
Aging Report
Track overdue invoices by age.
Aging Buckets:
- Current (0-30 days)
- 31-60 days overdue
- 61-90 days overdue
- 90+ days overdue
Sample:
Accounts Receivable Aging Report

Current (0-30): ₹1,25,000
31-60 days: ₹45,000
61-90 days: ₹18,500
90+ days: ₹4,400

Total Outstanding: ₹1,92,900
Invoice Status Report
Breakdown by status.
Shows:
- Count and value by status
- Status change timeline
- Conversion rates
Payment Reports
Payments Received
Track all incoming payments.
Includes:
- Payment date
- Amount
- Method
- Customer
- Invoice reference
Sample:
Payments Received - November 2024

Total Payments: ₹4,23,500
Number of Transactions: 67

By Method:
Bank Transfer: ₹2,85,000 (67%)
UPI: ₹89,500 (21%)
Cash: ₹34,000 (8%)
Card: ₹15,000 (4%)
Outstanding Payments
See what's owed.
Includes:
- Customer name
- Invoice number
- Amount due
- Days overdue
- Contact information
Payment Method Report
Analyze payment preferences.
Shows:
- Breakdown by method
- Average transaction size
- Processing fees
- Trends over time
Customer Reports
Customer List
Complete customer database.
Export Includes:
- Customer details
- Contact information
- Total business value
- Last transaction date
Top Customers
Identify best customers.
Ranked By:
- Total revenue
- Number of invoices
- Average order value
- Payment reliability
Sample:
Top 10 Customers - 2024

1. Acme Corporation
   Revenue: ₹5,45,000
   Invoices: 15
   Avg: ₹36,333

2. Tech Solutions Pvt Ltd
   Revenue: ₹4,23,500
   Invoices: 23
   Avg: ₹18,413
Customer Activity
Track customer engagement.
Shows:
- New customers
- Active customers
- Inactive customers
- Churn rate
Product Reports
Product Sales
Track product performance.
Includes:
- Units sold
- Revenue generated
- Growth trends
- Seasonal patterns
Sample:
Product Sales Report - 2024

Top Products:
1. Website Design Package
   Sold: 23 times
   Revenue: ₹5,75,000

2. Professional Consulting (Hourly)
   Hours: 456
   Revenue: ₹6,84,000
Inventory Report
(If inventory tracking enabled)
Shows:
- Stock levels
- Items sold
- Reorder alerts
- Stock value
Tax Reports
Tax Summary
Calculate tax collected.
Includes:
- GST/VAT collected
- Tax by rate (5%, 12%, 18%)
- Period totals
- Filing-ready formats
Sample:
GST Summary - Q4 2024

18% GST: ₹76,536
12% GST: ₹18,240
5% GST: ₹4,250

Total Tax Collected: ₹99,026

Output Tax: ₹99,026
Input Tax: ₹15,400
Net GST Payable: ₹83,626
Tax by Product
See which products generate tax revenue.
GSTR Reports (India)
GST return-ready reports.
Available:
- GSTR-1 (Outward supplies)
- GSTR-3B (Summary return)
- GSTR-9 (Annual return)
📅 Report Filters
Customize reports with filters:
Date Range
- Today
- This Week
- This Month
- This Quarter
- This Year
- Custom Date Range
- Last 30/60/90 days
Customer
- All Customers
- Specific Customer
- Customer Group
Status
- All Statuses
- Paid Only
- Pending Only
- Overdue Only
Product
- All Products
- Specific Product
- Category
Amount Range
- Minimum amount
- Maximum amount
📥 Exporting Reports
Download reports in various formats:
PDF
- Professional formatting
- Ready to print
- Email-friendly
Excel (XLSX)
- Editable spreadsheet
- Includes formulas
- Pivot table ready
CSV
- Import into other systems
- Database compatible
- Lightweight format
📊 Report Scheduling
Automate report generation:
Setup:
- Choose report type
- Set filters
- Select frequency:
- Daily
- Weekly
- Monthly
- Quarterly
- Add email recipients
- Save schedule
Example:
Scheduled Report: Monthly Sales Summary
Frequency: Last day of every month
Format: PDF + Excel
Recipients: owner@business.com, accounts@business.com
💡 Using Reports Effectively
- Review Weekly - Check key reports every week
- Track Trends - Look for patterns over time
- Act on Insights - Use data to make decisions
- Compare Periods - Month-over-month, year-over-year
- Monitor Overdue - Follow up on aged invoices
- Identify Top Customers - Focus on valuable clients
- Analyze Products - Promote best sellers
- Tax Compliance - Generate tax reports before deadlines
📈 Key Metrics to Monitor
Revenue Metrics
- Monthly Recurring Revenue (MRR)
- Average Invoice Value
- Revenue Growth Rate
Customer Metrics
- Customer Acquisition
- Customer Lifetime Value
- Customer Retention Rate
Operational Metrics
- Average Payment Time
- Invoice-to-Cash Cycle
- Overdue Percentage
Financial Health
- Outstanding AR
- Collection Efficiency
- Profit Margins
🎯 Common Report Use Cases
Monthly Financial Review
- Generate Sales Report
- Check Payment Report
- Review Aging Report
- Calculate Tax Summary
Customer Analysis
- Run Top Customers Report
- Check Customer Activity
- Identify At-Risk Customers
- Plan retention strategies
Tax Filing Preparation
- Generate Tax Summary
- Export GSTR Reports
- Verify tax calculations
- Submit to accountant
Business Planning
- Analyze revenue trends
- Forecast next quarter
- Identify growth opportunities
- Set targets
🚀 Next Steps
- Invoice Management - Managing invoices
- Payment Tracking - Payment management
- Settings - Configure reporting options
Ready to generate reports? Explore specific report types in the next sections! 👉